Accuracy Results
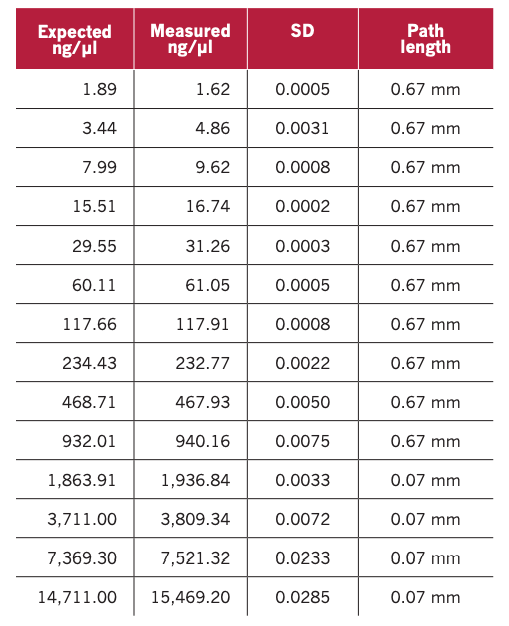
Table 1 demonstrates the expected DNA concentration and the mean value of the five measurements of each DNA concentration. Additionally, the standard deviation of the mean absorbance at the 0.67 mm / 0.07 mm path of each sample is listed.
The Nucleic Acid Spectrophotometer, Ratio
The Nucleic Acid Spectrophotometer, NanoPhotometer® NP80, calculates the 260/230 and 260/280 ratios which give information about contaminants of the sample. The 260/230 ratio should be > 1.8, lower ratios indicate contamination with e.g. guanidinium thiocyanate or other buffer salts (TRIS, EDTA) used during the nucleic acid isolation/purification. The 260/280 ratio indicates the presence of proteins in the nucleic acid sample. Pure DNA and RNA preparations have expected ratios of ≥ 1.8 and ≥ 2.0, respectively.
Linearity Results
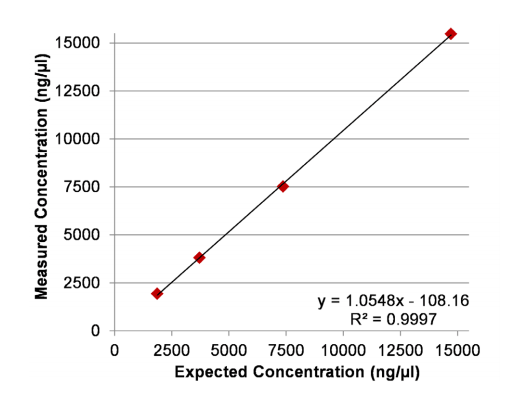
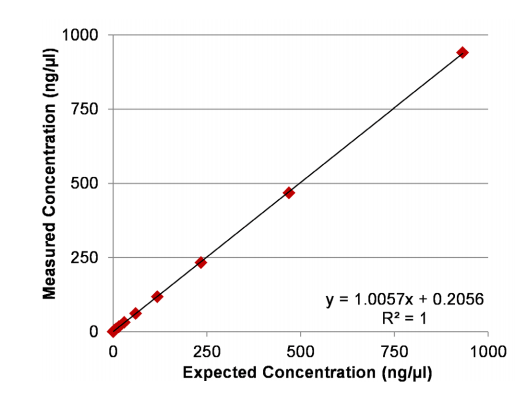
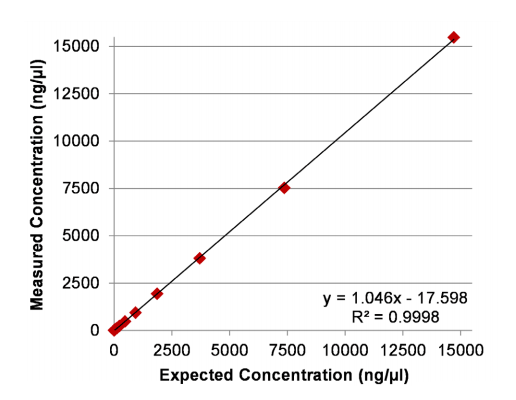
The resulting linearity curve in the range of 1.89 – 14,711 ng/µl shows a close correlation between expected and measured concentrations with a coefficient of determination (R2) of 0.9998 (Figure 1).
