What is a Protein Assay Spectrophotometer
Rapid and accurate estimation of protein concentration is essential in laboratory practice. Depending on the protein sample and buffers utilized, the optimal spectrophotometrical method should be performed. Direct Protein UV measurements at 280 nm require pure proteins solved in buffers without absorbance interference at 280 nm. If these conditions are unable to be met, it is recommended to use a protein assay.
How to Measure Protein Assay Concentrations
Protein concentration may be measured using colorimetric assays, in which certain reagents are added to the protein solution to generate a colored product; either a protein-cupric ion chelate as in the Biuret, Lowry, BCA assays or a protein-dye complex as in the Bradford assay. In these colorimetric assays, the absorbance is measured in the visible range at the appropriate wavelength for each assay and compared against a standard curve prepared by serial dilution of a protein standard of known concentration.
A linear, linear zero or 2nd order regression analysis of the calibration standard data points is calculated by the NanoPhotometer®, one of the top Protein Assay spectrophotometers on the market. A correlation coefficient (R2) in the range of 0.95 to 1.00 indicates a good fit to a straight line. Bradford Assay Method depends on quantifying the binding of a dye, Coomassie Brilliant Blue, to an unknown protein and comparing this binding to that of a standard curve prepared from a set of known protein of known concentrations at 595 nm. This standard is usually BSA (bovine serum albumin).
Biuret Assay Method depends on a reaction between cupric ions and peptide bonds in an alkali solution, resulting in the formation of a complex absorbing at 546 nm. Note: Biuret is only available for cuvette measurements (Protein Assay Spectrophotometers, NanoPhotometers® NP80 and C40).

What is BCA Assay Method?
What is Lowry Assay Method?
Lowry Assay Method is based on the Biuret reaction. Under alkaline conditions the divalent copper ion forms a complex with peptide bonds in which it is reduced to a monovalent ion. Monovalent copper ion and the radical groups of tyrosine, tryptophan, and cysteine react with Folin reagent to produce an unstable product that becomes reduced to molybdenum/tungsten blue. The bound reagent changes color from yellow to blue. This binding is compared with that obtained with a standard protein at 750 nm; this is usually BSA (bovine serum albumin).
The optimal colorimetric assay should be chosen depending on the linear range of the assay and the interference of buffer components with the assay reagents. For more details please refer to the manufacturer’s directions.
The focus of the following paragraphs is on the Bradford assay on a micro volume scale (Bradford 1976).
What is Bradford Protein Assay Method?
The Bradford assay is a spectroscopic analytical procedure for rapid detection and quantification of total protein in a solution. The method relies upon the formation of protein-dye complexes. The dye, Coomassie Brilliant Blue, exists in three forms: cationic, neutral, and anionic (Compton and Jones 1985). In an acidic environment, the dye binds protein in solution, resulting in a change from its cationic (red) form to a protein bound anionic (blue) form. The anionic form has a maximum absorbance at 590 nm (Amax = 590 nm). The protein-dye complex can best be detected using a Protein Assay Spectrophotometer at 595 nm. Accordingly, the quantity of protein can be estimated by detection of the amount of anionic dye formed (Kruger 2002).
The binding of an unknown protein can then be compared to a standard curve prepared from a set of known concentration protein standards at 595 nm. The assay is performed at room temperature (RT) and does not require special equipment.
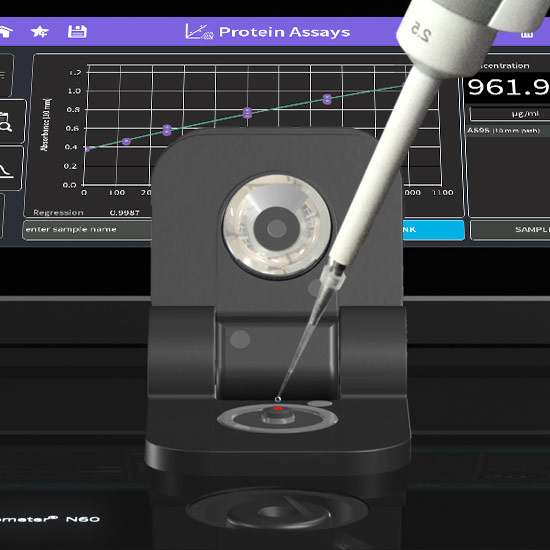
Material
• Coomassie Plus – The Better Bradford Assay Reagent (Thermo Scientific #23238) and Pre-Diluted Protein Assay Standards: Bovine Serum Albumin (BSA) Set (Thermo Scientific #23208) were used for all Bradford measurements.
• Measurements were done in the Protein Assay method of a Protein Assay Spectrophotometer, NanoPhotometer® NP80/N60/N50.
Assay Protocol
• Protein Assay Protocol focuses on NanoVolume measurements.
• For Bradford assays in cuvette mode, please refer to the
manufacturer’s directions.
• The linear range for Bradford assays on the NanoPhotometer®
NP80/N60 is 0–2000 µg/ml and for the NanoPhotometer®
N50 0–1000 µg/ml BSA.
• A 50:1 sample volume to assay reagent was used and
incubated for 10 minutes at room temperature.
Bradford Protein Assay with the NanoPhotometer®
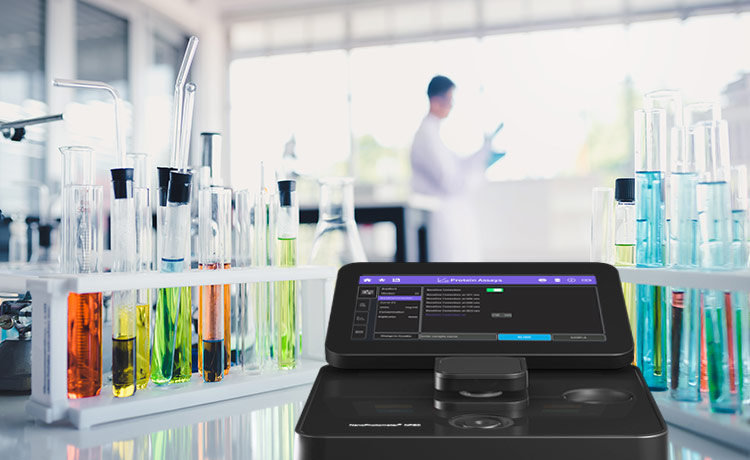
Preparation of Standards and Samples with Unknown Concentration
- Equilibrate the Bradford reagent, BSA standards and
unknown samples to room temperature. - Add 250 µl of Bradford reagent in reaction tubes.
Note: For each replicate prepare a separate tube.
Note: it is recommended to add a zero reference to
the standard curve. Prepare the zero standard with
Bradford reagent and ddH2O. - Add 5 µl of standard or unknown sample to each
reaction tube. - Mix well/vortex the reaction tubes.
- Incubate for 10 minutes at RT.
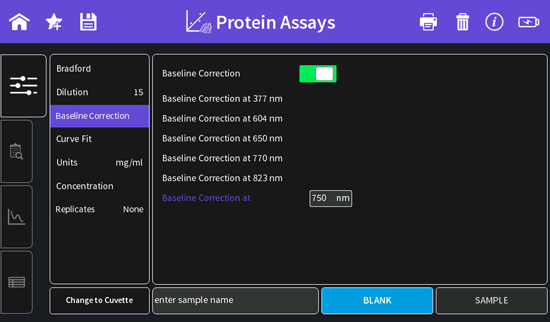
Parameter settings in Protein Assay method in NanoPhotometer®
- Bradford (595 nm)
- Dilution 15/0.67 mm path
- Baseline correction:
NanoPhotometer® NP80/N60 to 750 nm
NanoPhotometer® N50 to 350 nm - Curve Fit: Regression 2nd order
- Units: Depends on the standards used
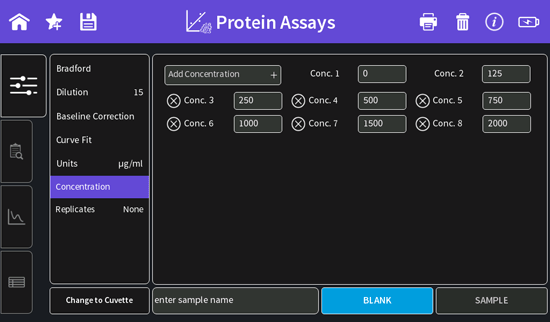
- Concentration: Enter the concentrations of the used standards. Concentrations can be added by clicking on the “Add Concentration” button. Pre-diluted BSA standards of Thermo Scientific: 0 µg/ml; 125 µg/ml; 250 µg/ml; 500 µg/ml; 750 µg/ml; 1000 µg/ml; 1500 µg/ml and 2000 µg/ml.
- Replicates: Three replicates recommended
How to Measure Protein Assays
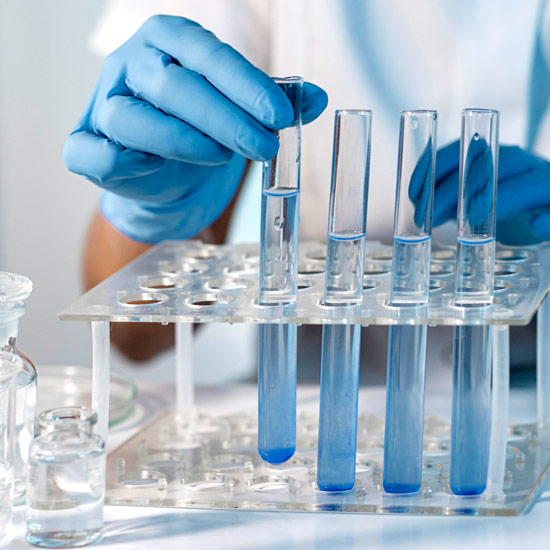
Create Standard Curve
- Use 2 µl of ddH2O for the Blank measurement
- Measure 2 µl of each standard/standard replicate step by step.
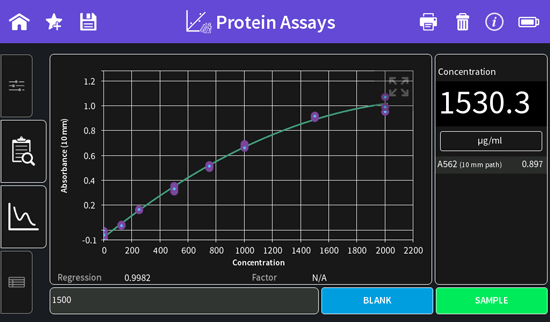
- Once all standards are measured, the standard curve is shown and the Regression is calculated. It is possible to exclude single standard or replicate measurements from the standard curve calculation by switching the toggle switch off.
Please note that changes to the standard curve are only possible prior to measurement of the first sample (first unknown sample).
Measure Unknown Samples
Use 2 µl sample volume for measurements of unknown samples. Concentration will be shown in the results and table view.
Cleaning
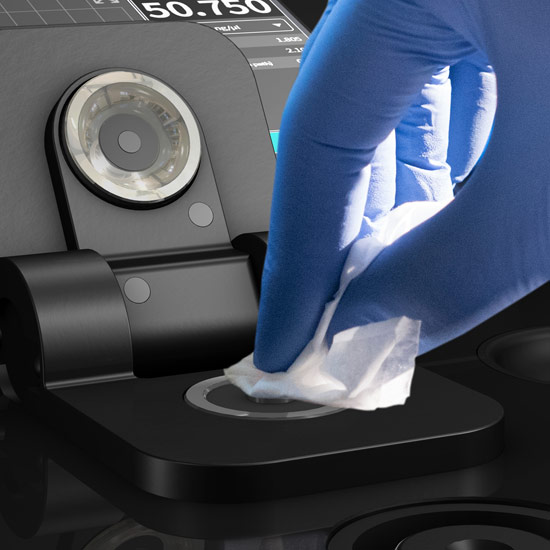
Clean the measurement head and the mirror in the sample arm carefully after each blank/standard/sample measurement with a slightly wet fluff-free tissue.
Protein Assay Measurement Results
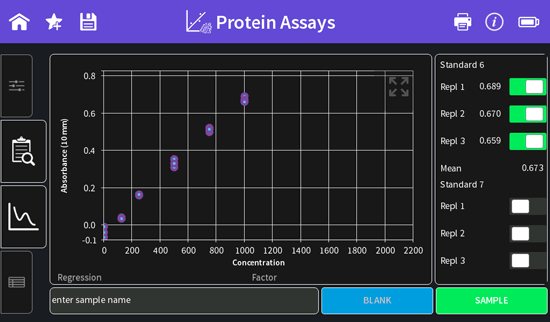
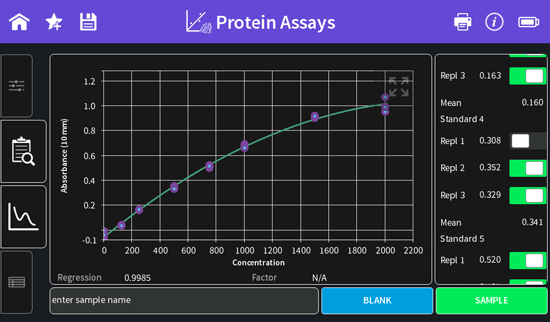
Typical standard curves for Bradford assays are shown in Figure 1 and 2. Figure 1 shows a standard curve in the range of 0–2000 µg/ml BSA measured on the Protein Assay Spectrophotometer, NanoPhotometer® N60 showing a coefficient of determination (R2) of 0.9978. Figure 2 shows a standard curve in the range of 0–1000 µg/ml BSA measured on the Protein Assay Spectrophotometer, NanoPhotometer® N50 showing a coefficient of determination (R2) of 0.9992.
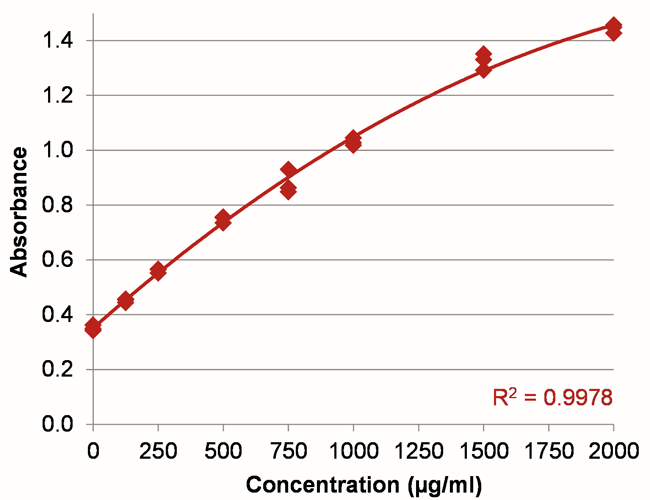
Figure 1: BSA standard curve in the range of 0–2000 µg/ml using a 50:1 sample to assay reagent ratio.
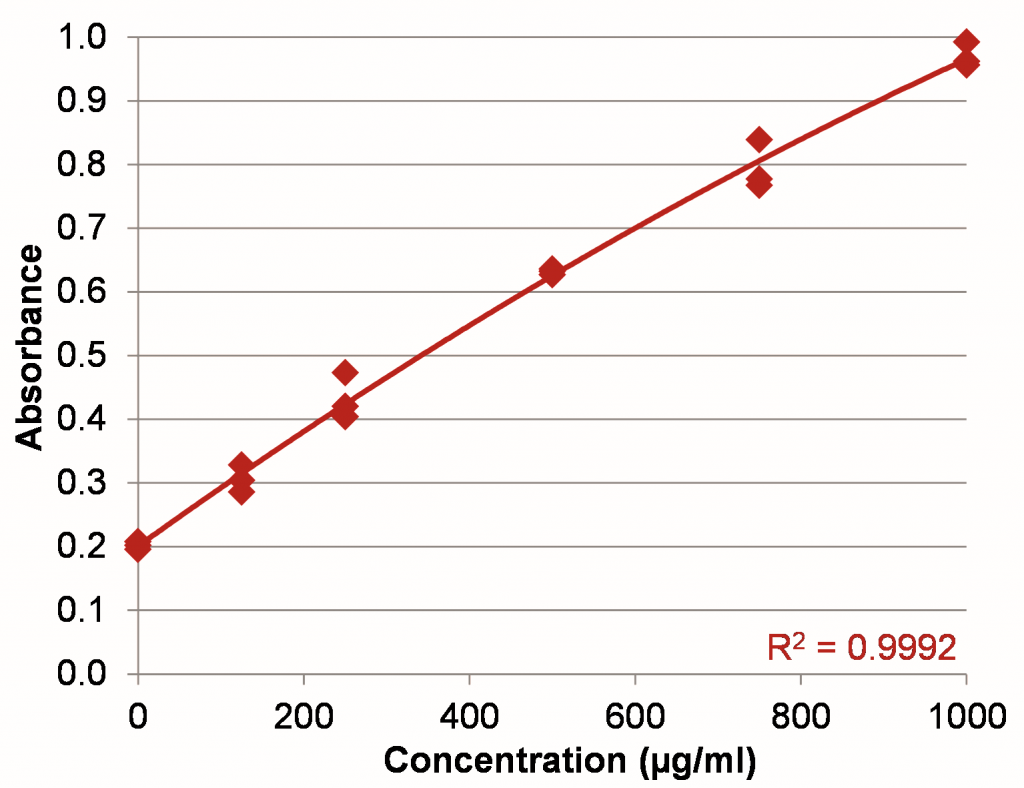
Figure 2: BSA standard curve in the range of 0–1000 µg/ml using a 50:1 sample to assay reagent ratio.
Accuracy and Linearity of the NanoPhotometer®, Protein Assay Spectrophotometer
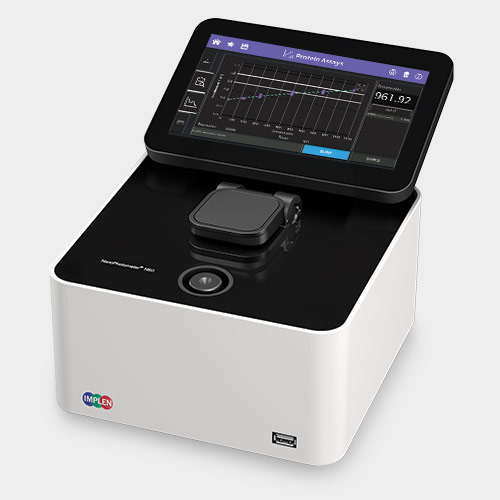
The NanoPhotometer® is the only Protein Assay spectrophotometer with True Path Technology™ providing accurate results without the need for recalibration throughout the entire lifetime of the instrument.
NanoPhotometer® Models that Work Best for Protein Assay Quantification
All units are battery powered and require NO maintenance or recalibration for a lifetime. They also can be used for the following applications: dsDNA, ssDNA, RNA, mRNA, miRNA, Oligos, Proteins and Antibodies including dye labeled samples, small molecules in organic solvents, kinetics in a drop and more.
|
|
|
|
“Great results and very accurate!”
Rating: 5.0 ★★★★★
Application Area: Protein assays and concentrations
“I love love love this machine. It’s portable, idiot proof, and accurate. For its DNA analysis, it is much more accurate than the old familiar, Nanodrop. I love the fact that it is so modifiable and easy to use. We use it for a variety of functions in the lab, including Bradford assays. I really love that there is a built-in graph for these and that you can email it to yourself or save on a USB stick. This machine is the thing we have all been needing but never knew we missed. Also the customer care is outstanding and I look forward to our rep every time she comes.”
Andrea Kuipers
Organization: California Institute of Technology, USA
“Producto NP80-Touch”
Rating: 5.0 ★★★★★
Application Area: Biologia celular y desarrollo
“Es un buen producto que facilita con rapidez y eficacia la medición de ácidos nucleicos y proteínas.”
Dr. Jesus Aguirre
Organization: Instituto de Fisiologia Celular, Mexico
“Great results! will highly recommend it for protein measurements. “
Rating: 4.7 ★★★★★
Application Area: Antibody measurements
“Great product! We use it to measure antibody concentration. It is easy and efficient! They also have a great customer care service! The instrument has become an irreplaceable part of our company.”
Veena Kumari
Organization: Neobiotechnologies, USA
“Great machine with great results “
Rating: 4.7 ★★★★★
Application Area: Analysis of RNA, DNA, and protein concentrations
“This is an easy to use machine that gives great results. We have run it against several standard curves. Would definitely recommend it.”
George Perry
Organization: South Dakota State University, USA
“Best small volume spec on the market”
Rating: 5.0 ★★★★★
Application Area: Protein/nucleic acid quantitation
“The Implen NanoPhotometer N50 is extremely easy to use (intuitive menus and settings), accurate, and genuinely capable of measuring very small volumes repeatably. The touch screen works well even with gloves. Window configurations are adaptable so you can customize the information you’re looking at while working. The instrument is light and mobile, and since it’s all-in-one, you can literally move it to where you’re working as needed. It’s not stuck in a particular corner of the lab. In my opinion, it’s the best nano-scale measurement device on the market for routine lab sample quantification and spectral reading.”
David Rawling
Organization: Inflammatix, Inc., USA
“Small but excellent”
Rating: 5.0 ★★★★★
Application Area: Gastroenterologie/Hepatologie, Medizinisches Forschungszentrum
“The N60 is an excellent product for determining concentrations of nucleic acids and proteins. Advantages include the accessibility of measured data, as the device exports measurements as .csv and .pdf files and that the device can be cleaned with 70% Ethanol and water. Plus, it contains an in-built vortexer.”
Dr. Sabrina Rüschenbaum
Organization: Universitätsklinikum Essen AöR, Germany
“A wonderful instrument for nucleotide or protein quantification”
Rating: 5.0 ★★★★★
Application Area: Life Science
“It’s a delicate but powerful instrument which occupies very small space and is always on call.
As soon as one acquires this in his lab, he can enjoy the convenience and accuracy at the same time.”
Yu Ran
Organization: Zhejiang University, China
“Great accuracy of measurements, easy usage, really nice interface.”
Rating: 5.0 ★★★★★
Application Area: determination of the concentration of proteins and nucleic acids solutions
“C40 NanoPhotometer is a great tool to measure macromolecule concentrations in microvolumes. It surpasses our previous nanodrop machine as it does not need calibration and has more functions. Easy interface is a great advantage and the new function of enzyme kinetics together with vortex makes this small and handy tool a multitask help in our lab. The wi-fi functions enables us to print spectra quickly. Measurements are repeatable and accurate. I would recommend the equipment every biochemistry lab.”
Joanna Sliwiak
Organization: Institute of Bioorganic Chemistry, Laboratory of Protein Engineering, USA

